A User Manual of
IDEAL
Intrinsically Disordered proteins with Extensive Annotations and Literature
IDEAL, Intrinsically Disordered proteins with Extensive Annotations and Literature (https://www.ideal-db.org/), is a collection of knowledge on experimentally verified intrinsically disordered proteins (IDPs). IDEAL contains manual annotations by curators on intrinsically disordered regions (IDRs), interaction regions to other molecules, post-translational modification sites, references, structural domain assignments, and diagrams illustrating biological process.
IDEAL development team
Satoshi Fukuchi, Ph. D. Maebashi Institute of Technology
Motonori Ota, Ph. D. Nagoya University
ideal-admin@force.cs.is.nagoya-u.ac.jp
Revised on January 2024
Table of contents
1. Looking at data in IDEAL
1) Top page
2) Node, edge, network and diagram
3) The entry list
4) The biological process list
5) Node page
A)General information
B)Structure
C)Function
6)Edge page
7)Network page
8)Diagram page
2. Downloadable data
1) XML
2) Revised points from the old XML
3) RDF
1. Looking at data in IDEAL
1) Top page
The top page presents general introduction of IDEAL as well as search tools so that user can find proteins in interest [1, 2, 3]. In the fields [1] and [2], user can select one of "Full text", "Protein Name", "IDEAL ID", "UniProt accession", and "PDB id" categories.
IDEAL also provides the BLAST search from the Search menu [1]. User can input an amino acid sequence to find the homologs in IDEAL.
All data in IDEAL is downloadable in the XML format and RDF [5]. SPARQL search for the RDF is available from the SPARQL button [6] and the Search menu [1].
The IDEAL logo [7] is the link to the top page. The header (dark green bar) always locates at the top of any pages in IDEAL.
Another way to access IDEAL data is to open the lists by clicking "Browse" [4]. IDEAL provides the entry list and the biological process list that enumerate the proteins in IDEAL and the graphical diagrams representing their biological processes, respectively.
NeProc (Next ProS classifier) [8] predicts iIDRs and protein binding segments in IDRs, which are called ProS (Protean Segment) in IDEAL.
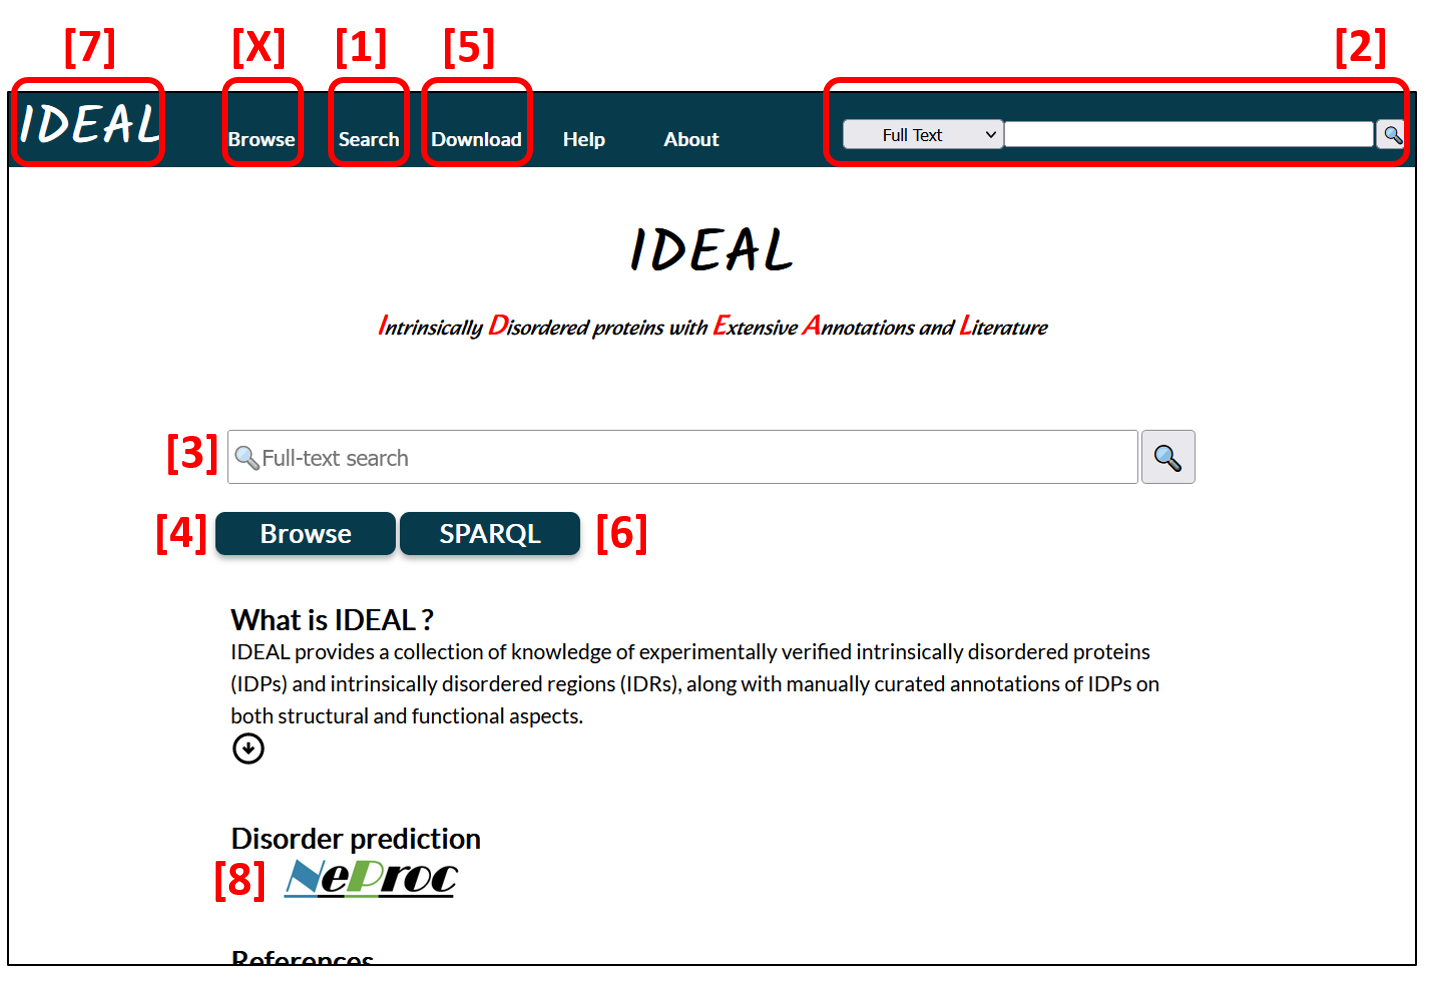
Figure 1: Top page of IDEAL. Red numbers indicate the location of buttons or fields etc. explained in the manuscript.
2) Node, edge, network and diagram
IDEAL prepared four types of web pages to show annotation for IDPs. The node page [9] provides detailed information for a protein (an entry). The edge page [10] represents an interaction of two proteins, i.e., a structural complex of the entry and its binding partner. The network page [11] illustrates a large-scale protein-protein interaction network containing the entry. The diagram page [12] show the schematic biological process relating to the entry. These pages are connected by link buttons described later. Then user can browse various information by cricking the buttons.

Figure 2: The entry page of Catenin beta-1 (IID00039). The link buttons to the edge [10], the network [11], and the diagram [12] pages are shown with their page images.
3) The entry list
The list tabulates all of the entries in the descending order by the IID (default). IID is labeled on each protein, starting from IID00001 for human proteins, IID50001 for other eukaryotic proteins, and IID90001 for proteins of the remaining organisms including viruses. IID can be clickable to present data of each entry.
User can sort the list by cricking the column names in the header [13]. The ProS, LLPS, Network and Diagram columns show presence of the relevant data in the entry page. The ProS is the protean segment, which is IDRs with ability of structural transformation (disorder to order or the reverse). The LLPS is the abbreviation of liquid-liquid phase separation, and the check in the column means that the entry page contains the links to the LLPS relating protein databases. The Network is the PPI network map, which contains the relevant entry. The diagram is the graph representation of biological process that includes the entry.

Figure 3: The entry list.
4) The biological process list
The list tabulates all biological processes that represent the interactions or pathways of proteins in IDEAL. The structure column [14] shows the key structural complex in the diagram as the combinations of gene names, and the title column [16] indicates the title of the PDB structure. Clicking on the Structure column displays the diagram page [15], where user can see a graph showing the sequential transition of the states (e.g., interactions or post-translational modifications) of the relevant proteins.
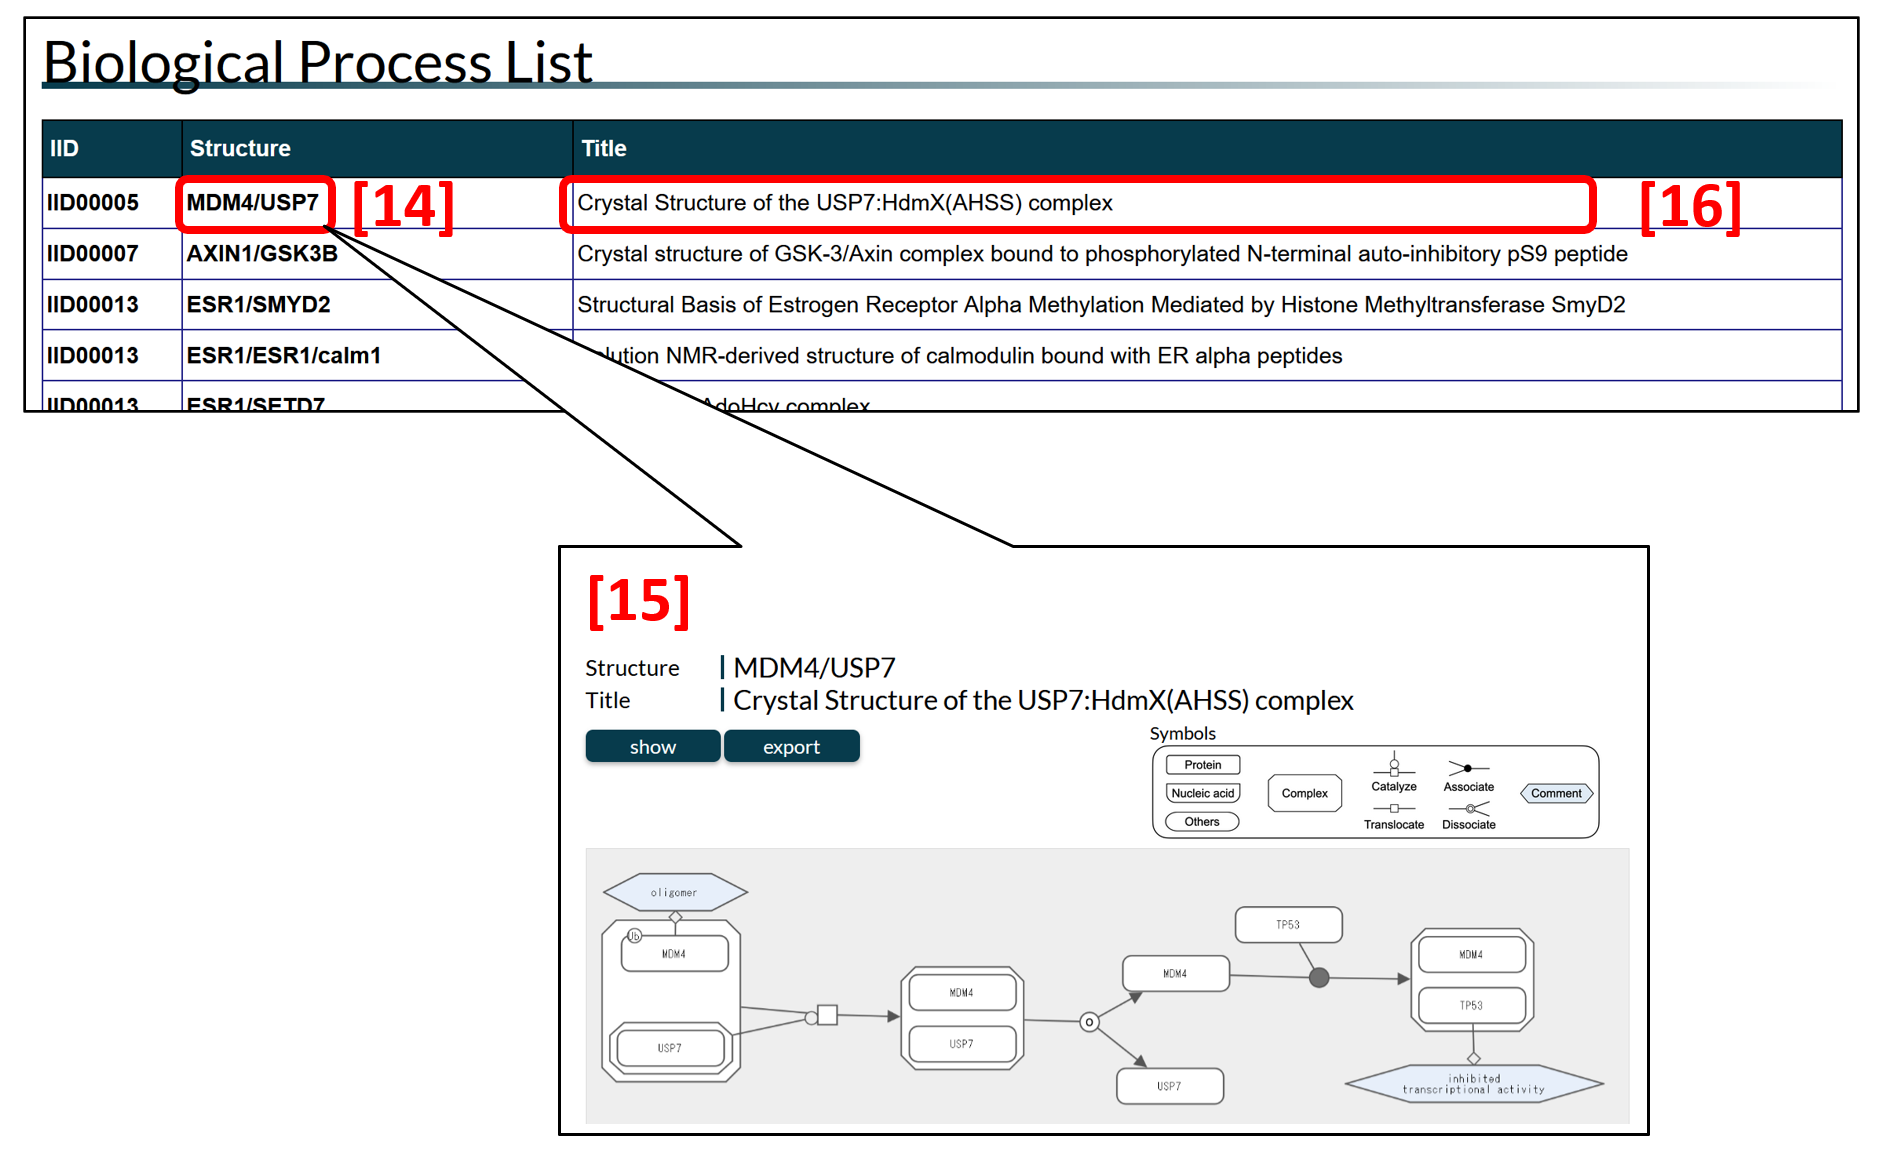
Figure 4: The biological process list. Clicking the symbols in the structure column [14], the diagram page appears [15].
5) Node page
The node page (Fig. 5) represents annotations for each entry (protein) in IDEAL. The annotations are arranged into three categories: A) general information, B) structure and C) function.
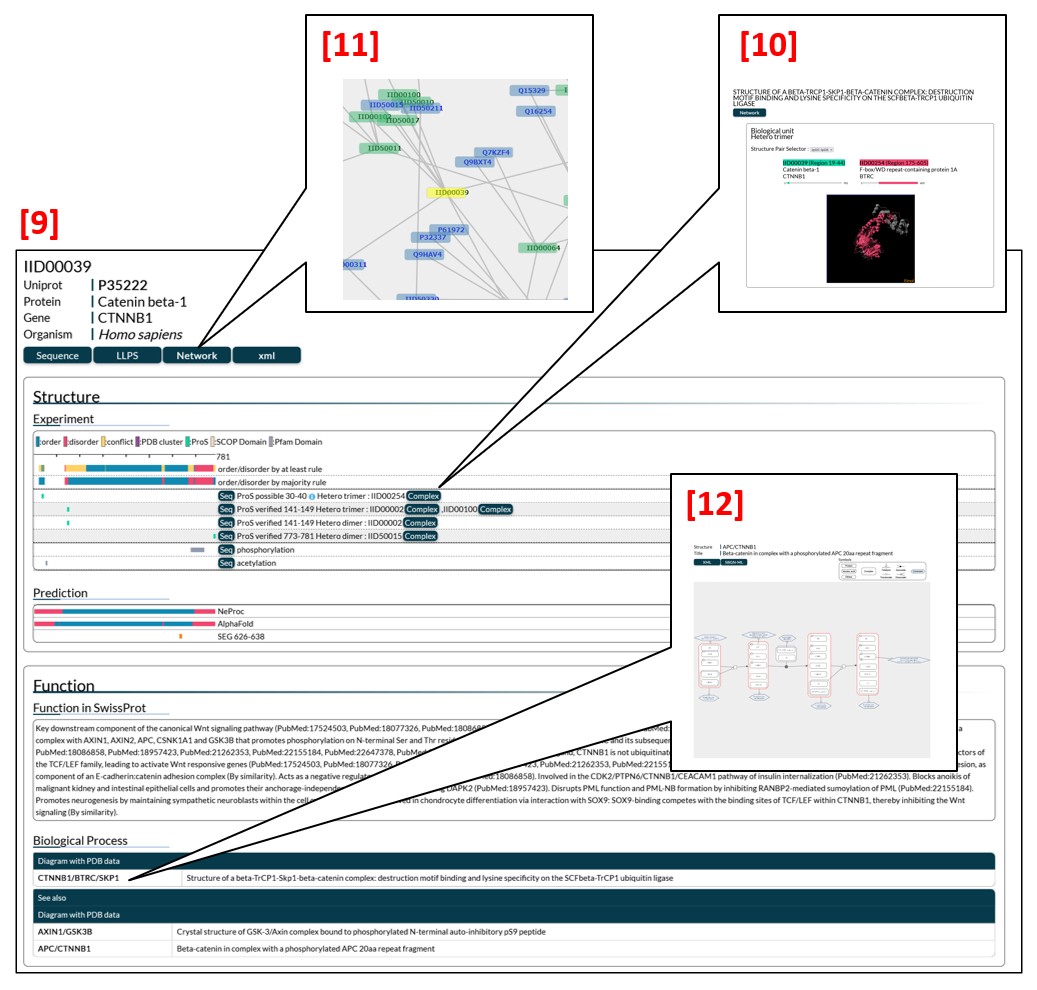
Figure 2: The entry page of Catenin beta-1 (IID00039).
A) General information
The identifier of IDEAL, IID, the protein name, the gene name, the source organism, and the link to UniProt are listed [17].
The amino acid sequence in the FASTA format is shown by Sequence button [18]. LLPS button is the links to annotations in four LLPS relating protein databases (PhaSepDB, PhaSePro, LLPSDB, DrLLPS) [19]. Network is the link button to the network page [20]. XML is the download button of the XML of the entry [21].

Figure 6: The part of general information for IID00039.
B) Structure
Structural annotations are schematically divided into the experimental section and the prediction section.
B-1) Experiment section
The section shows the annotations with the experimental evidence, e.g., PDB structures or NMR/CD experiment.
Two color bars [22] and [23] summarize the order/disorder annotations along the protein sequence. The "at least rule" bar [22] shows the summary based on the "at least rule". The "at least rule" assigns "order" ("disorder") to a region if the region was annotated as ordered (disordered) at least once. When the annotation is inconsistent, the region is annotated as conflict.
The "majority rule" bar [23] shows the summary by the "majority rule". The "majority rule" assigns "order" or "disorder" to a region according to the majority decision of all evidences.

Figure 7: Structural summary shown by the bar representation.
・How to see the regions annotated.
Some of the bars in the chart are click-able to show the detailed information.
Two bars [24] shows the breakdown of the "at least rule", which appears by clicking the "at least rule" bar. The first and the second bars correspond to the "at least" ordered regions, and the "at least" disordered regions, respectively.
Bars [25] shows the break down of the "majority rule", where all of the annotated ordered/disordered regions are presented. PDB entries in this field are clustered, and magenta bars are clickable to present clustered regions [26]. Clustering threshold is described below.
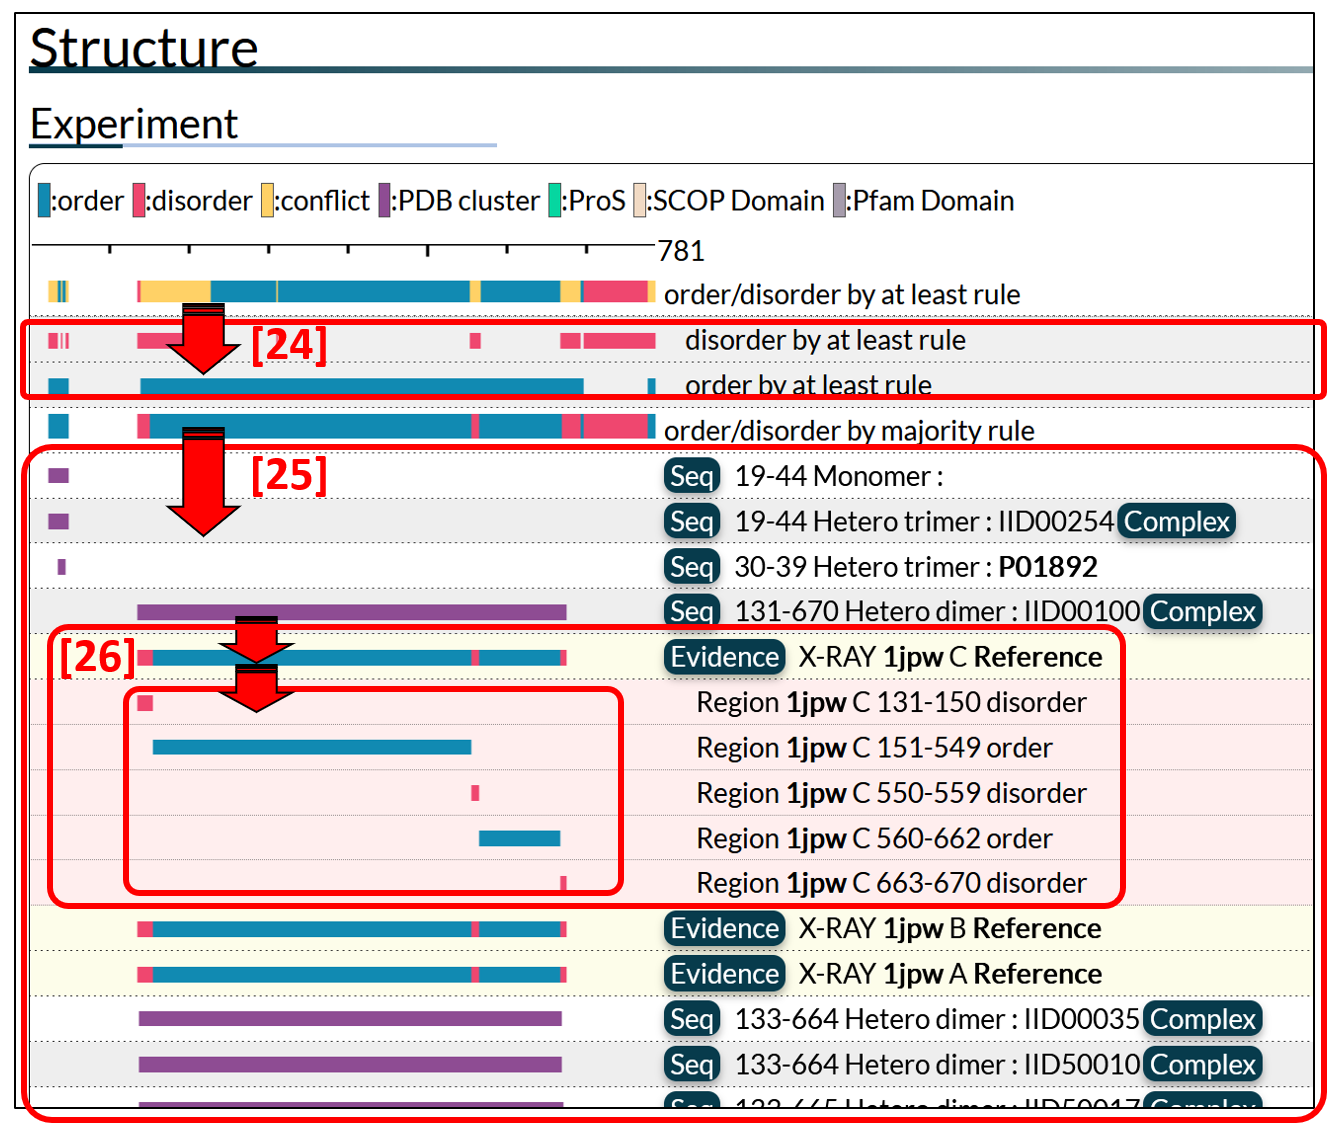
Figure 8: Breakdown of the structural summary bars. Clicking summary bars, each evidence for the annotation appear.
・Clustering PDB structures
We constructed clusters of almost equivalent PDB entries, employing biological assemblies. In the comparison of two complexes, they were firstly divided into subunits. When two subunits (a subunit pair) taken from each complex show more than 70% sequence identity, or their gap sites in the alignment are less than 7, the subunit pair is considered equivalent. Note that the latter condition is applied to compare short segments. When all subunits pairs in two complexes are equivalent, and the interacting-subunit pairs (having contacts) are the same, the complexes are considered equivalent, and should be clustered. Based on this rule, we conducted a single-linkage clustering, and obtained clusters of protein complexes. Monomers were also clustered in the same manner.
・Details in the annotation.
The Seq button [27] presents the FASTA formatted sequence high-lighting the corresponding region of the bar shown at the left side. The start and end residues for the structured/unstructured region and the oligomeric state follow the Seq button on the same line. When binding partners exist, IID or UniProt accession is presented. The Complex button [28] is a link to the edge page showing the protein complex. Clicking the magenta bar, detailed annotation of the cluster appears [29]. Red and blue represent disordered and ordered regions. The Evidence button [30] shows the experimental data for the annotation together with experimental method, PDB identifiers with chain ID [31], and "Reference" of PubMed [32].
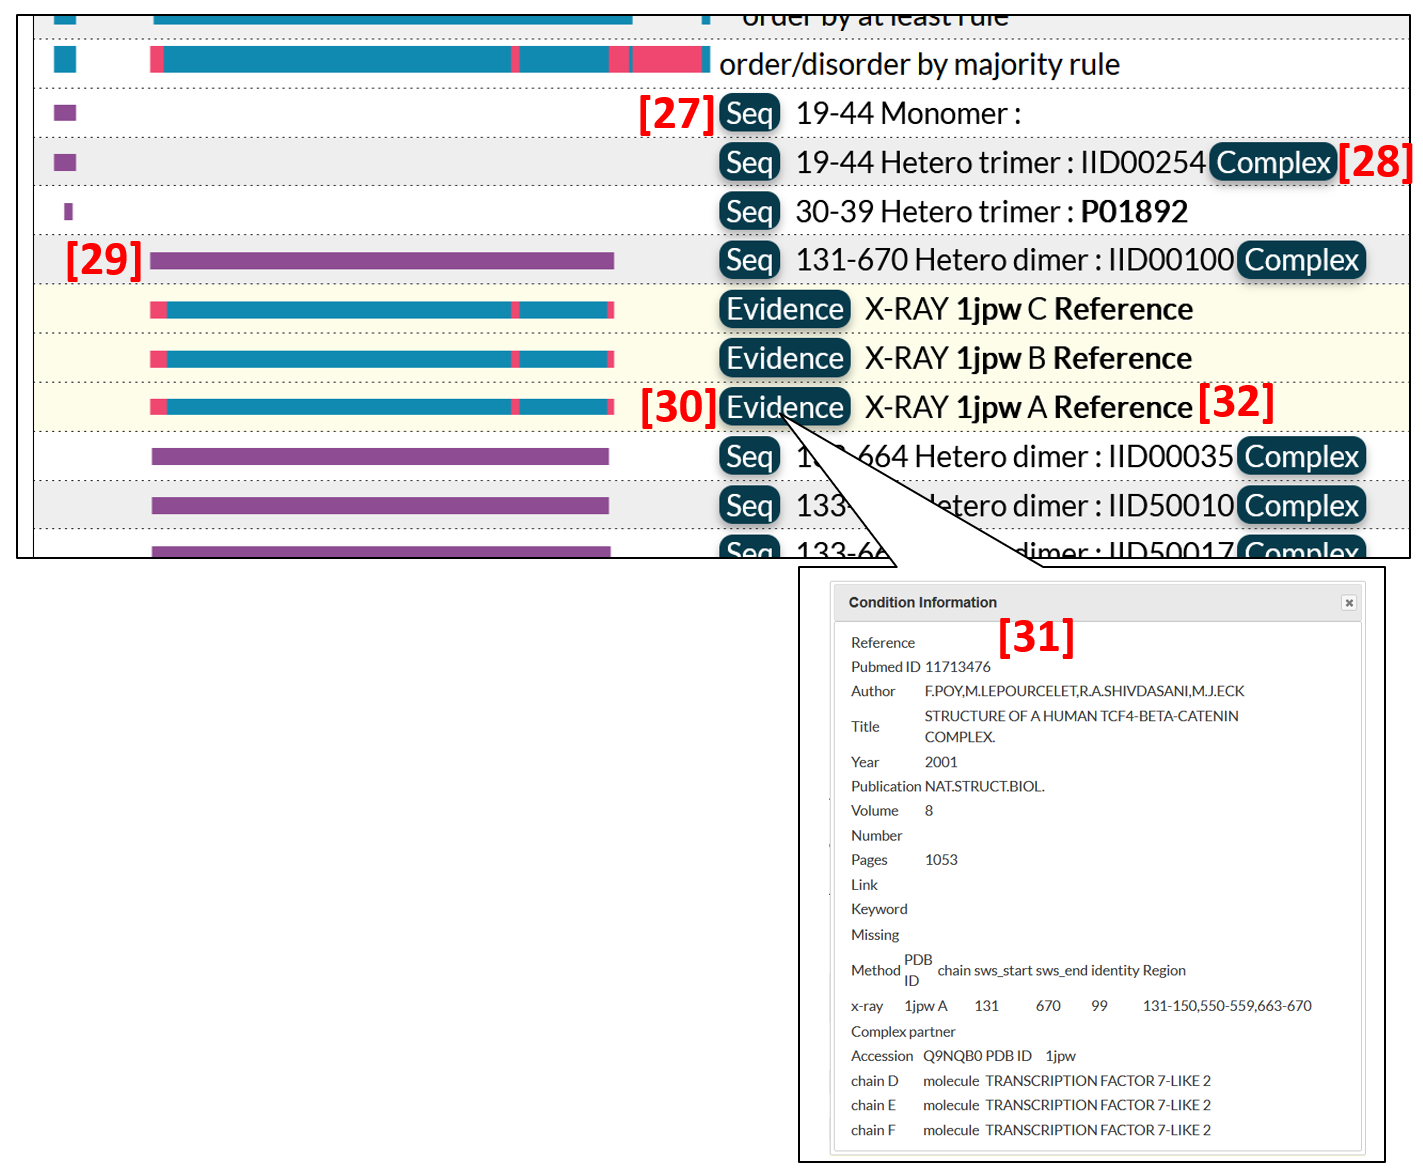
Figure 9: Detail of the structure annotation for ordered/disordered regions.
・The protean segment (ProS)
The section [33] shows protean segments, ProS. One of the reasons why IDPs have drawn much attention is attributed to the phenomenon so-called coupled folding and binding, where a short flexible segment can bind to its binding partner with forming a specific structure to act as a molecular recognition element. IDEAL explicitly annotates these regions as protean segments (Other names are MoRF, SLiM or DIBS etc.).
We defined three categories for ProS, verified ProS, possible ProS and predicted ProS. A verified ProS is defined as the sequence, which has both evidences of disordered in an isolated state and of ordered in a binding state with a partner molecule or vise versa. A possible ProS is defined as the sequence, which only has an evidence of ordered in a binding state, but is thought to be a ProS from circumstantial evidences, for example disorder evidence in homologs, even though it has no evidence of disordered in an isolated state. A predicted ProS is a new category introduced from the IDEAL version 20/Nov/2017. A predicted ProS is defined as the sequence, which only has an evidence of ordered in a binding state, but is thought to be disordered in an isolated state by manual inspections and the results of disorder-prediction tools, AlphaFold and NeProc. When the binding partner exists in IDEAL, a link to the edge page is available [34].
The green bars in the ProS section can expand by a click to show the ordered and disordered regions accounting for the ProS [35, 36]. The clustering results are adopted in the ProS presentation. In this case, C and D chains of 3diw are clustered, being presented in a single green bar. In the case of "possible or predicted ProS", only an ordered region is presented [36].

Figure 10: Annotation of protean segments (ProSs)
・Miscellaneous information from UniProt
Below the ProS section, miscellaneous information such as interaction regions and ぽsposttranslational modification sites from UniProt is summarized [37]. Each bar is crick-able to see the details [38].

Figure 11: Miscellaneous information cited from UniProt
In addition to the experiment section, IDEAL provide the prediction section, in which prediction results of disorder/order prediction by NeProc and AlphaFold, and SEG [39] are shown.
Each bar is a crick-able to show the details. The [40] box shows NeProc prediction result. Predicted ordered, disordered and ProS regions are presented by blue. Red and skyblue bars, respectively. The [41] box is the results of AlphaFol. We optimized pLDDT threshold using data of IDEAL and regards the regions with less than 68% pLDDT are disordered. Note that AlphaFold cannot predict the entire region of protein sequence more than 2700 residues (the results are not shown).
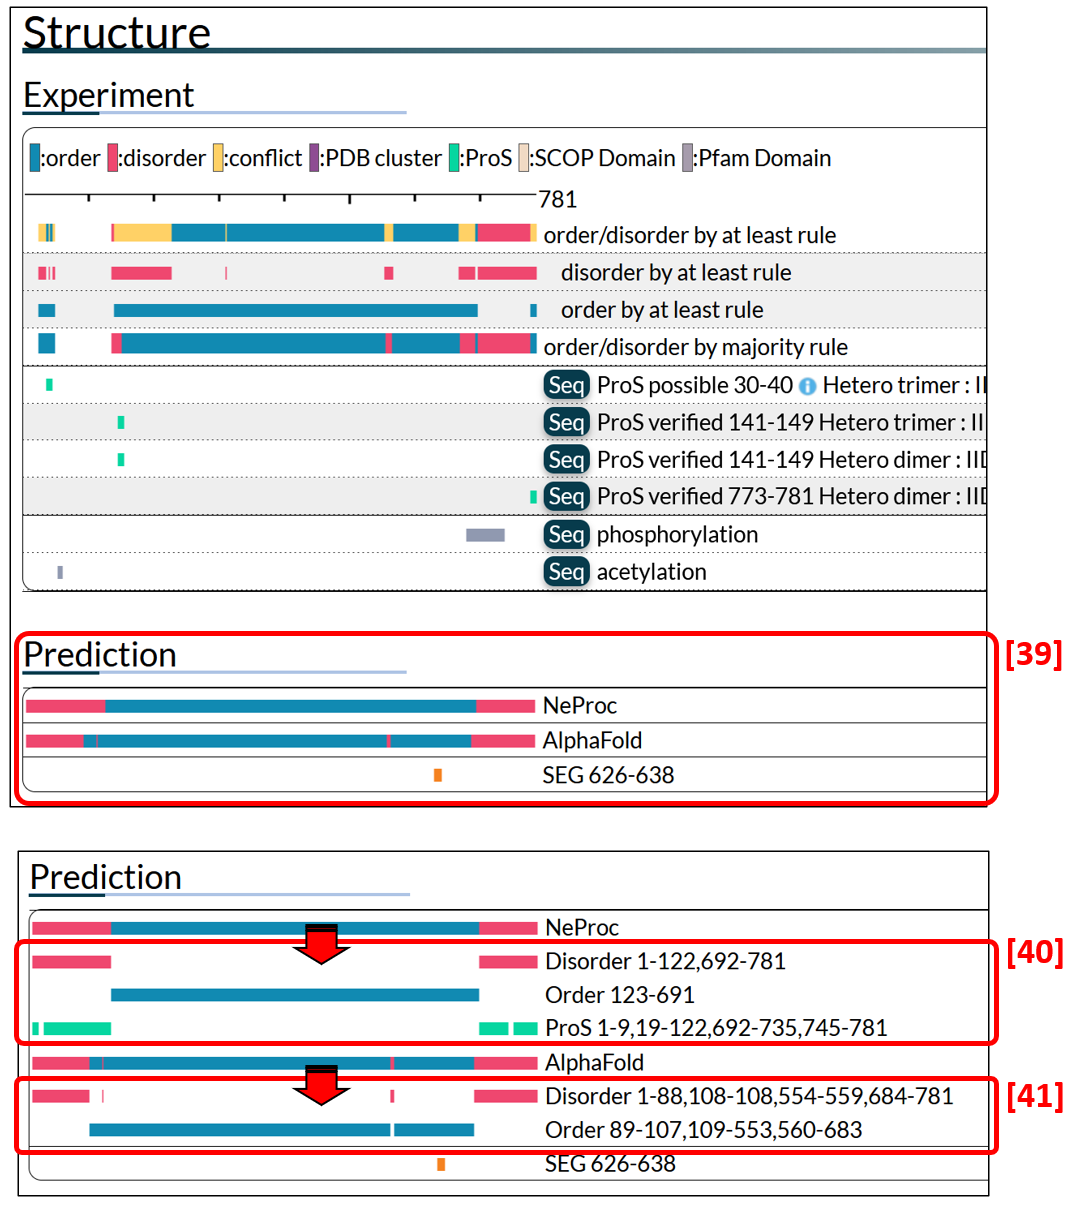
Figure 12: The results of disorder prediction (NeProc and AlphaFold) and low complexity regions (SEG).
C) Function
・Function in SwissProt
For the convenience of users, summary of the function denoted in SwissProt is presented in IDEAL [X]. When multiple descriptions for isoforms are presented, the relevant molecules are shown at the beginning.
・Biological Process
Many IDPs change their states (e.g., interactions or subcellular locations) by post-translational modifications, or other stimulus etc. IDEAL presents such transitions of states by diagrams of biological process. For catenin beta-1 (gene name: CTNNB1), list of links to the diagrams is shown [24], in which CTNNB1 plays an important role in the transition. Additionally, CTNNB1 appears in the diagrams of other entries (e.g., APC). In such case, diagrams are shown after "See also" sign [25]. Clicking "APC/CTNNB1" displays a diagram of APC [27].
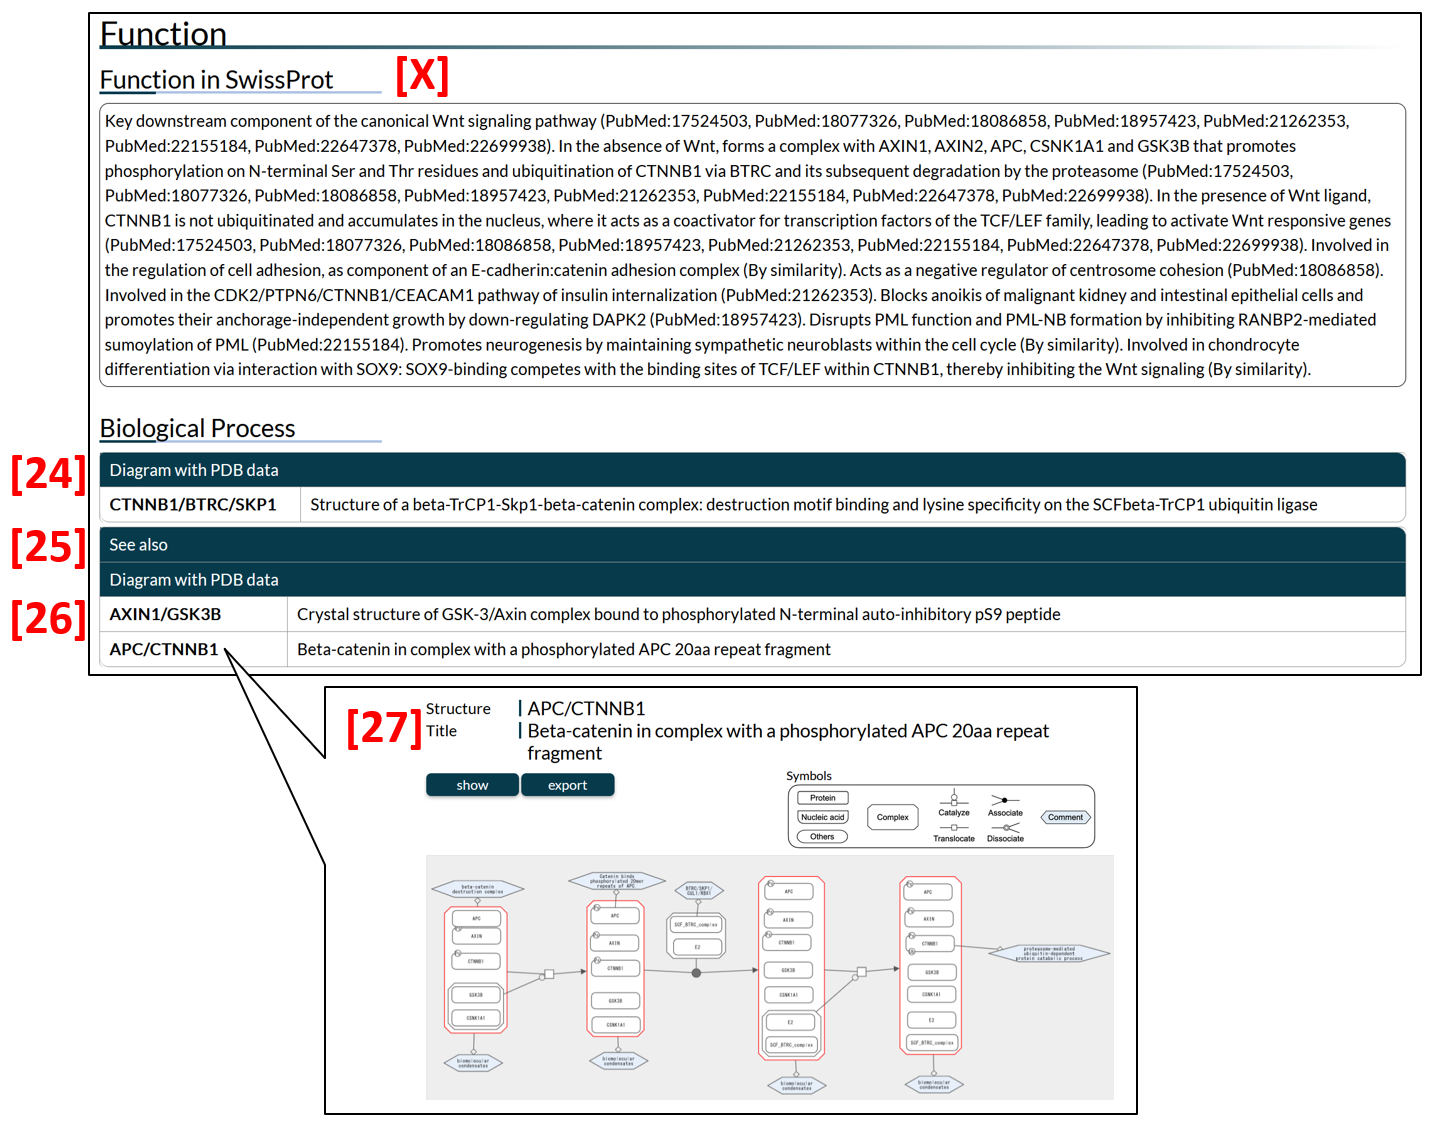
Figure 13: Presentations of protein function.
6) Edge page
Figure 14 is an example of the edge pages. Edge pages provide structural complexes of an IDEAL entry and its binding partner. In this case, the complex of catenine beta-1 and transcription factor 7-like 1-A is shown. The structure is displayed by the J-mol applet [28], in which user can rotate or zoom the molecules. The cartoon is colored in the same color shown in [29], where the corresponding regions are also presented. IID [30] are the links to each entry page. The PDB structures are clustered (see the clustering PDB section), and the structure pair selector [31] enable one to choose a protein complex displayed. By clicking the Network button [32], user can see the Protein-Protein Interaction (PPI) network, to which this protein complex belongs.
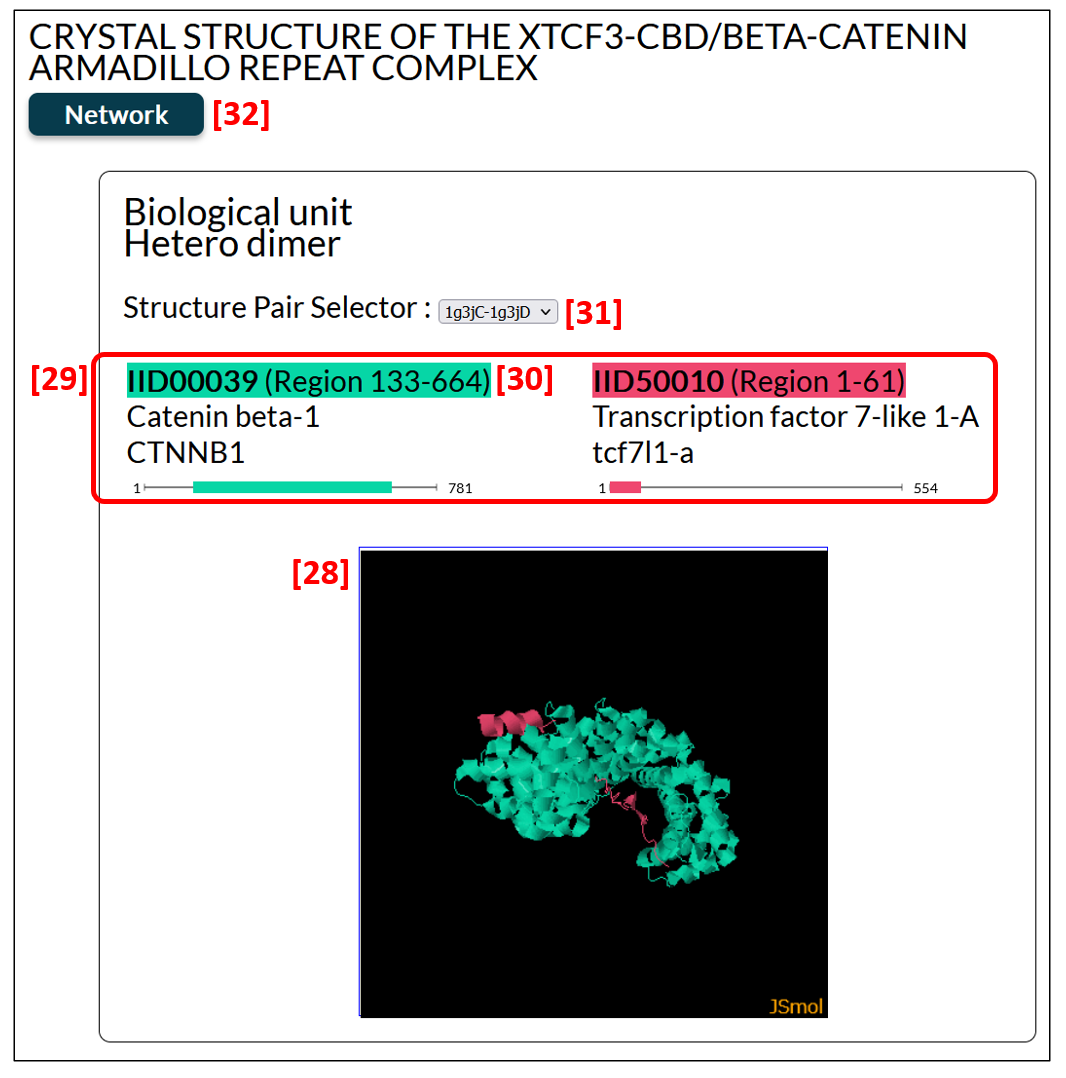
Figure 14: An example of the edge page, in which protein complex is shown.
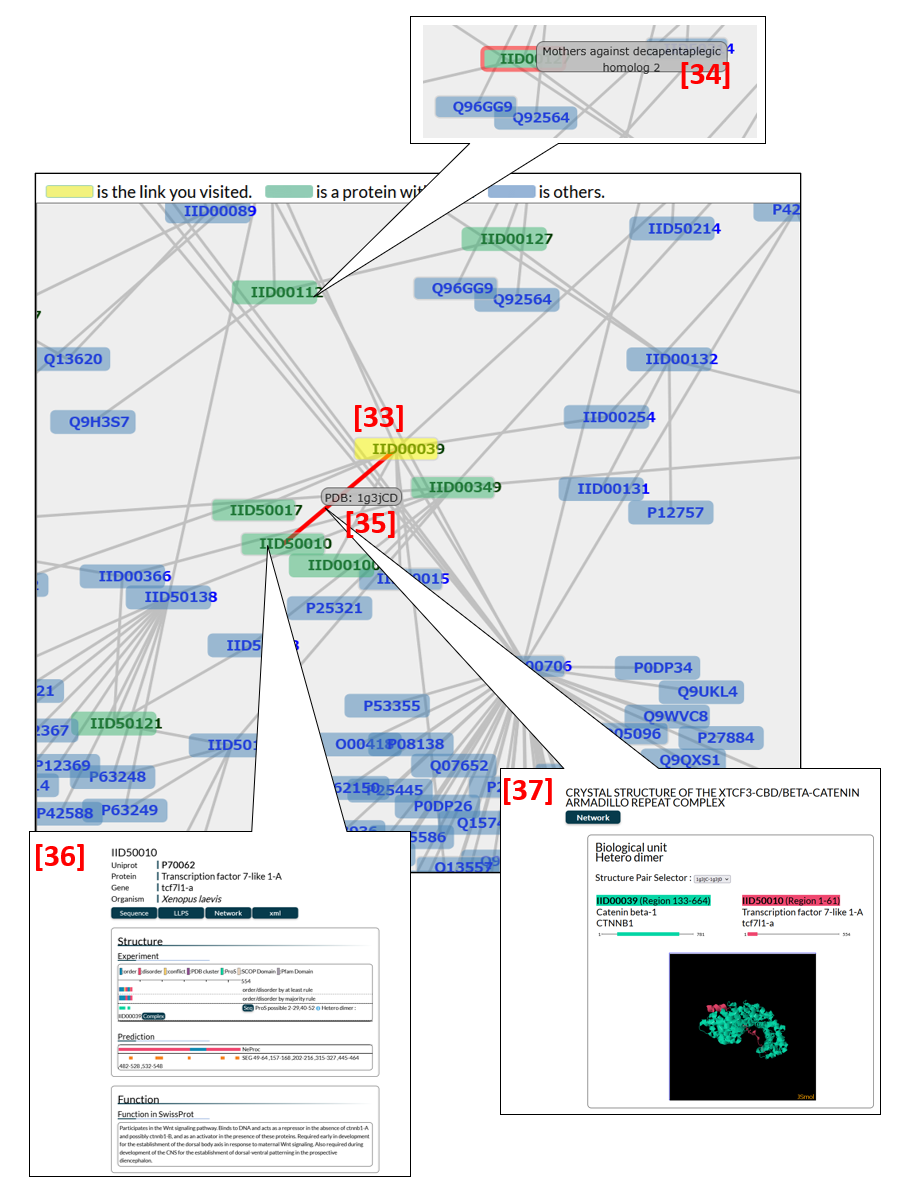
7) Network page
A large-scale PPI network is shown. The protein from which the network is generated is in yellow [33]. Moving the pointer on a network node gives the protein name [34]. Green ones are proteins with at least one ProS. Moving the pointer on a network edge gives the PDB ID with the pair of chain names [35].
Each "node" is clickable to see the node page [36]. User can enlarge and reduce the map by the middle wheel on a mouse (win & mac) or two finger scroll (mac). Also, users can grasp the network by dragging the mouse and modify its shape as they want to be. Each "edge" is clickable to see the edge page [37].
Figure 15: An example of the network page.
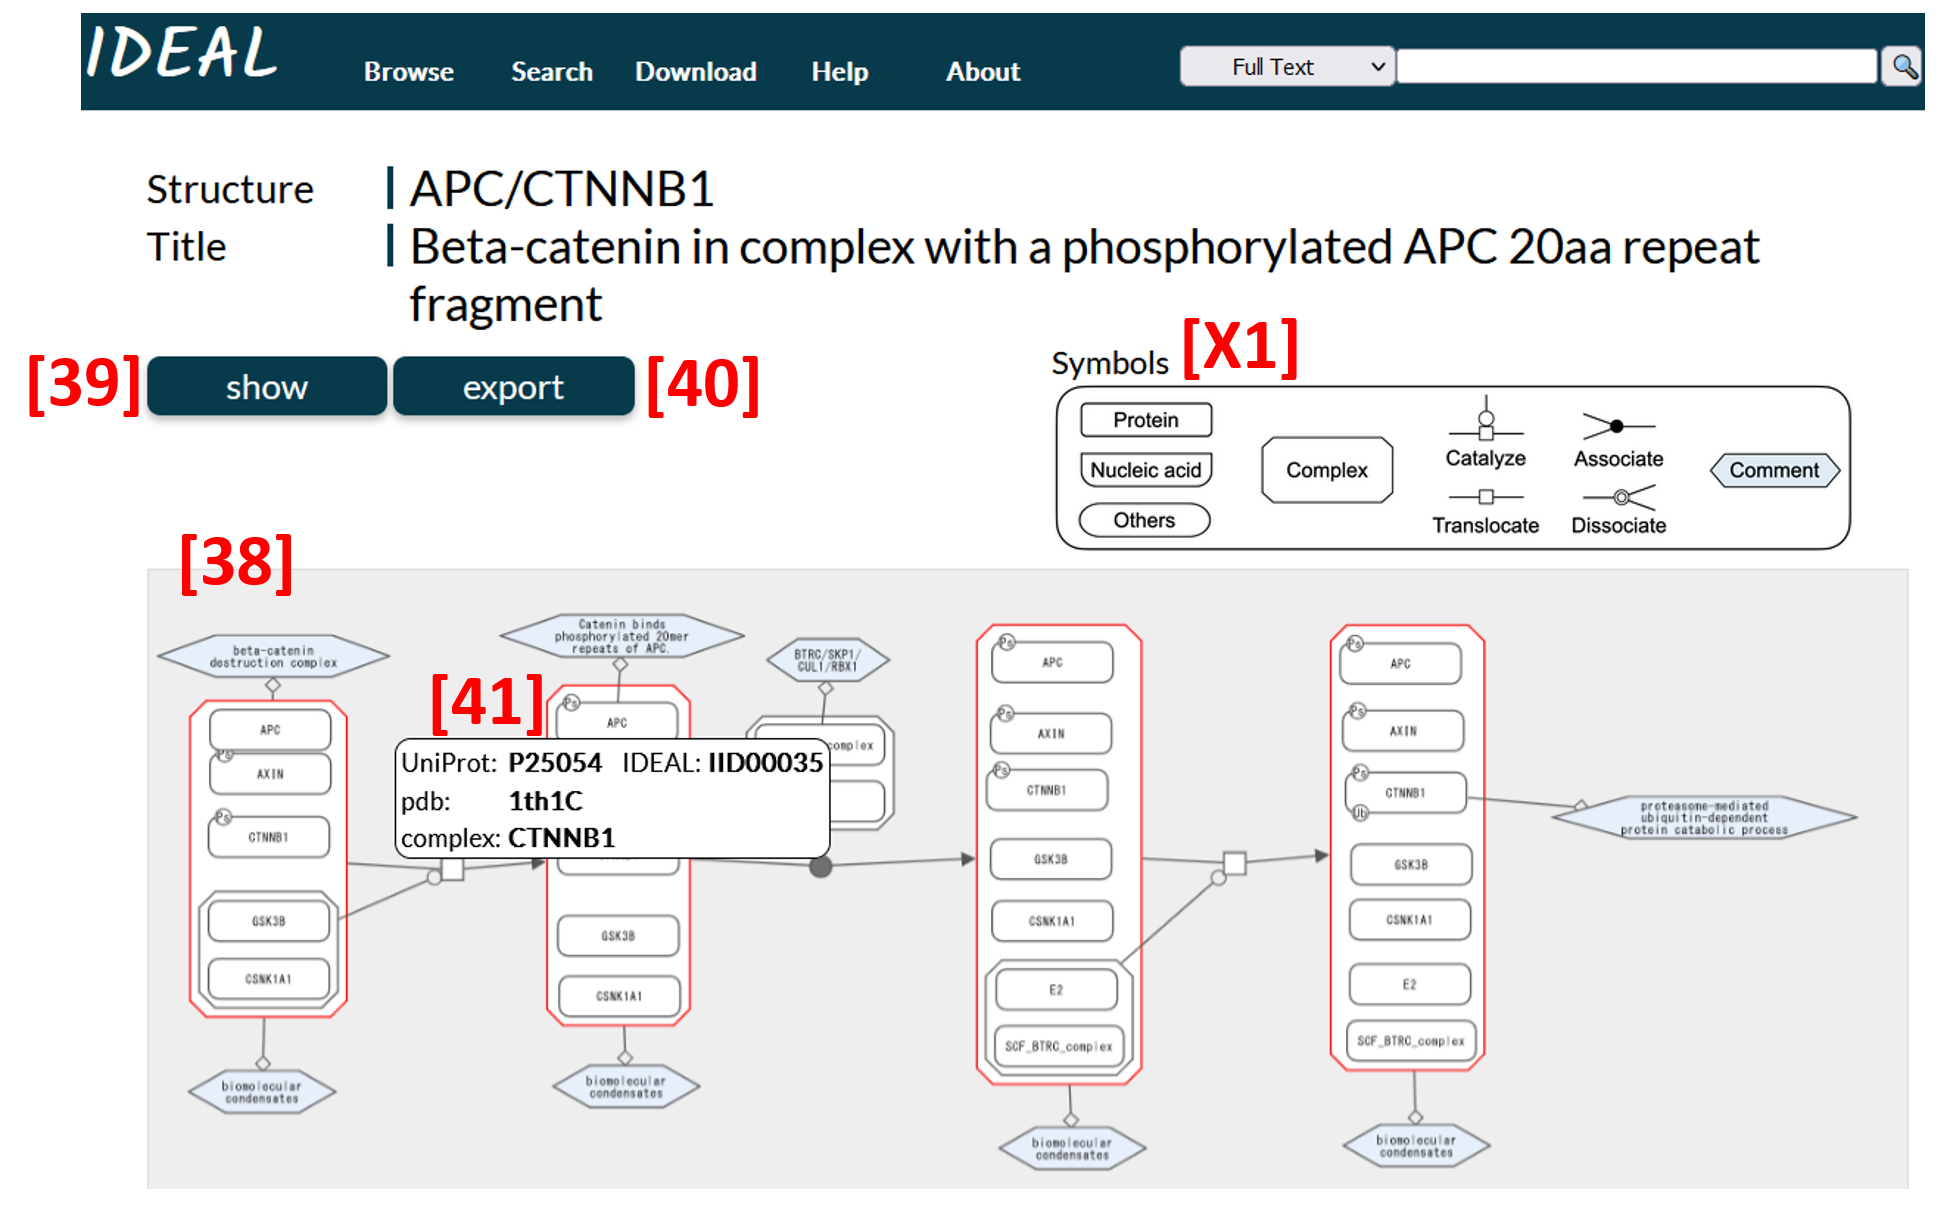
8) Diagram page
A network diagram [38] is displayed, in which transitions of states or the biological process of IDPs triggered by post-translational modifications (PTMs), etc. are illustrated. The picture can be zoomed in and out, and the nodes can be moved with the mouse, and so on. Then, user can arrange the diagram for their needs. Clicking on the show button displays data for transitions in XML format [39] on the browser screen. Data is also downloadable in XML format as well as SBGN-ML which can be used to reproduce the diagram by the graph software such as ChiSE on the user’s computer. A PNG file of the Diagram can be also downloaded [40].
A pop-up [41] is displayed when the mouse is hovered over each symbol. The pop-up shows the UniProt Accession, IDEAL ID and PDB ID registered for the node (protein or complex) in question, and they are the link buttons for node page etc. "Complex" in the pop-up is the link button to the edge page.
Figure 16: An example of diagram page (APC/CTNNB1)
Symbols used in the diagram
######################################### RESUME ###########################
Connecting arcs
状態変化として、リン酸化などはcatalyze、結合はassociate、解離はdissociate、核内移行など局在の変化はtranslocation
のConnecting arcsで表示。
Comment
コメントは青いノードに記載。局在に関する情報(Location)、機能などに関する情報(Phenotype)、複合体の構成などに関する情報(Complex)がある。
PTM
修飾の情報は丸囲み内に以下のシンボルで表示。
Phosphorylation:Pは1残基のリン酸化、Psは複数残基のリン酸化。
Ubiquitination:mUbはmonoubiquitination、Ubはpolyubiquitination、mUbsは複数残基のmonoubiquitination、Ubsは複数残基のpolyubiquitination。
Methylation:Meはメチル化の数不明、またはme1, me2, me3のいずれもありうる場合、me1はmonomethylation、me1sは複数のmonomethylation、me2はdemethylation、me2sは複数のdemethylation、me3はtrimethylation、me3sは複数のtrimethylation。
Hydroxylation:OHは1残基の水酸化、OHsは複数残基の水酸化。
Fig.17

2. Downloadable data
1) XML
All data in IDEAL is downloadable in the XML format and RDF [5] . 各エントリのデータはNODE pageのxmlボタン[21]から、遷移データは遷移図画面のexportボタン[40]から取得できる。遷移データには状態遷移に関する記述(XML)と、それにDiagram内での各ノードの位置情報を付けたもの(SBGN-ML)もある。
Fig.18

2) Revised points from the old XML
2024年●月●日にIDEALをリニューアルし、XMLの構成を変更。主な変更点は遷移データの追加に伴うIDEAL_BiologicalProcessタグの追加など。詳細はXMLチャート(https://www.ideal-db.org/help_main.html)を参照。
Fig.19

3) RDF
IDEALデータはRDFフォーマットでも提供している。Top pageのSPARQL [6] をクリックするとDBCLSサーバー内のVirtuoso SPARQL Query Editor が開く。[41]
Fig.20

